The research was supported by a grant from the National Institute of Mental Health (MH42465) to Frances K. Graham and Robert F. Simons and contains aspects of both the Ph.D. dissertation of Mark A. Miles and the MA thesis of Xun Chen. Portions of this paper were presented at the 39th annual meeting of the Society for Psychophysiological Research, Granada, Spain, October, 1999.
Address correspondence to Robert F. Simons, Department of Psychology, University of Delaware, Newark, DE 19716.
![]()
![]()
Deviant
stimuli give rise to a late positive ERP component with latencies from 250-400
ms. Target deviants elicit a P300
with maximum amplitude over parieto-central recording sites while the ‘P300’
elicited by deviant nontarget stimuli occurs somewhat earlier and shows a more
frontally-oriented scalp distribution. Two
varieties of frontal P300s have been described, elicited either by rare stimuli
(target or nontarget) presented in a two-stimulus oddball task (P3a)
or by infrequent, unrecognizable stimuli presented in the context of a
three-stimulus oddball task (Novelty-P3).
The Novelty-P3 has been observed in a number of subsequent
studies; the P3a has not been extensively studied and both its significance and
existence have been called into question. The
present report describes a replication of two prototypical studies with
‘frontal’ P3s observed in each context.
Application of factor analysis to the two sets of ERP waveforms does not
support a distinction between these two components.
![]()
In 1975, two papers were published that reported the
existence of positive ERP components that were either antecedent or temporally
coincident with the oddball-elicited P300 (Courchesne, Hillyard & Galambos,
1975; Squires, Squires & Hillyard, 1975).
In both papers, the positivity had a more anterior scalp distribution
than the parieto-central distribution that characterized the traditional P300.
The component described by Squires et al. was referred to as the P3a and
was observed in response to infrequent stimuli during an oddball task or to the
same stimuli when unattended; Courchesne et al. described a component they
labeled the Novels-P3 that they observed in response to rare, unexpected stimuli
inserted unexpectedly as a third stimulus type during an otherwise traditional
oddball task. They initially argued that it was the relative uncodability
of their novel stimuli that prompted the more anterior P3 response, but it has
been subsequently demonstrated by Polich and colleagues (Comerchero, Katayama
& Polich, 2000) that codability is not a necessary stimulus characteristic.
Research on the Novels-P3 (which we will refer to as the Novelty-P3) has been vigorous and the basic phenomenon has been demostrated in many laboratories (e.g., Cycowicz & Friedman, 1999; Katayama & Polich, 1998; Knight, 1984; Mecklinger & Ullsperger, 1995; Spencer, Dien & Donchin, 1999) using visual (Comerchero & Polich, 2000), acoustic (Courchesne et al., 1984), and tactile stimuli (Knight, 1996) with little apparent difference across modalities. Knight & Scabini (1998) describe the Novelty-P3 as an ERP measure of “neural activity in a distributed multimodal corticolimbic-orienting system that processes novel events”.
The P3a is a more evanescent component (Squires et al., 1977; but see also Snyder & Hillyard, 1976) and research targeting the P3a, qua P3a, has waned. There are no studies in the literature that directly compare the P3a and the Novelty-P3 and it is increasingly common for the two labels to be used interchangeably. In some recent papers, for example (Clark et al., 2000; Comerchero & Polich, 2000; Knight, 1996), P3a explicitly refers to announced deviants in three-stimulus attention tasks while in other papers (Harmony et al., 2000; Kaipio et al., 2000; Mathalon, Ford & Pfefferbaum, 2000) P3a is used in its more traditional sense (i.e., as in Squires et al., 1975).
The existence of these more frontally oriented positive components in addition to the more commonly observed parietal (P3b) component has important theoretical implications relevant to attention and orienting and distinctions between the two frontal components may be important as well. To date, however, evidence that these two frontal positivities are distinct and independent has been largely anecdotal or based on preliminary speculations of Courchesne et al. (1975). Because much of this evidence favoring a distinction has not withstood empirical scrutiny (see Discussion) and because of the confusion in terminology, we undertook the present analysis to revisit the two components and to address the nature of their relationship. As part of two independent projects, we elicited the P3a and the Novelty-P3 with prototypical procedures, conducted factor analyses of the data sets containing the two components, then employed a variety of methods recommended by Roemer, Josiassen & Shagass (1990) for determining whether the principal components and their associated factor scores based on the two sets of ERP waveforms span the same or different factor space. To remain consistent with the initial description and labels of the two components, we refer to P3a as the anterior positivity that is elicited by rare stimuli in traditional two-stimulus oddball tasks and the Novelty-P3 as the anterior positivity elicited by the unexpected novel stimuli delivered to subjects during three-stimulus novelty tasks.
![]()
Nine
University of Delaware undergraduate students (6 female) served as subjects in
the replication of Squires et al. (1975) and were paid $5.00/ hour for their
participation. Four
additional volunteers were excluded – one had a recent loss of consciousness,
one for a hearing disability that made pitch discrimination too difficult, and
two for apparatus problems. Twenty-four
undergraduate subjects participated in the replication of Courchesne et al.
(1975) and these subjects received either course credit or were paid at $5.00
per hour. The data from one subject
was lost due to apparatus failure. Nine
subjects (6 female) were randomly selected from the remaining group of
twenty-three and the data from these subjects were retained for the present
analysis. None of the nine
subjects had participated in the Squires task.
Because
Courchesne et al. (1984) and numerous others have observed the Novelty-P3 in
response to acoustic stimuli and because we wished to avoid any possible
modality confound in our analysis of the two components, the procedures we
employed to elicit the relevant ERPs were exclusively acoustic.
Exact replication of the Squires et al. (1975; Experiment 2) procedures
were used to elicit the P3a. Two 70
dB (A) acoustic stimuli, differing in pitch (1000 Hz & 1500 Hz) were
presented in a random sequence. Stimulus
duration was 50 ms and the inter-stimulus interval was 1.1 s. In different blocks of stimuli, the probability of the 1500
Hz tone was 0.1, 0.5, and 0.9. The
probability of the 1000 Hz tone was complimentary. Subjects were instructed to count the high tone, the low tone
or to ignore all tones in different blocks.
The resulting nine blocks (three probability levels X three instructions)
were presented twice, in reverse order
Three
acoustic stimuli were employed in the Courchesne replication and were presented
to subjects during three trial blocks of 170 trials each.
Two of the stimuli were synthesized speech sounds (‘me’, ‘you’)
and the third was novel – described by Courchesne et al. as “a
patchwork of natural sounds consisting of human vocalizations, mechanical noises
and digitally synthesized nonsense sounds”.
All stimuli used in this procedure were digitized from an audiotape
obtained directly from E. Courchesne. The
duration of each stimulus was 200 ms; they were presented at 75 dB (A) with
inter-trial intervals of 1700 ms. During
the first block of trials, only ‘me’-standards (p=0.9) and ‘you’-targets (p=0.1) were presented. In a second block of trials, a single exemplar of the novels
category was introduced, unannounced, and presented on 10% of the trials
interspersed with targets (p=.10) and
standards (p=0.8). During a third
block of trials, novels again constituted 10% of the trials, but in this
case, each novel was unique. The
order of the second and third trial-blocks was counterbalanced across subjects
and the novels and targets were matched for ordinal position within each
block. As in the Squires task,
subjects were instructed to simply count targets1.
As
in the Squires at al. (1975) and Courchesne et al. (1975, 1984) studies, EEG was
recorded from three midline recording sites (Fz, Cz, and Pz) referenced to the
right mastoid. The EEG (.5-35
Hz) was digitized at 500 cps and corrected for vertical eye movement and blink
artifact (Gratton, Coles & Donchin, 1983; Miller, Gratton & Yee, 1988). From the Squires task, ERPs were retained from the four 200
stimulus blocks in which subjects were instructed to count the infrequent
stimuli (p=0.1; either high or low tone) and the four 200 stimulus blocks in
which subjects counted the frequent stimuli.
Averages were then computed at each electrode site for rare target, rare
nontarget, frequent target and frequent nontarget stimuli.
From the Courchesne task, ERPs were retained for all eight instances of
standard, target and novel stimuli.
To evaluate the similarity of the P3a and the Novelty-P3 in the manner suggested by Roemer et al. (1990), the twenty-four ERP averages from the two data sets were combined and submitted to factor analysis (PCA) using the covariance matrix. The PCA was conducted twice. The first PCA computed basis waves solely from the ‘Squires’ ERPs and used these basis waves to compute factor scores for all ERPs in the combined data set. The second PCA used only ‘Courchesne’-derived basis waves for the computation of the factor scores. To better visualize the late positive components in the factor space, the PCA was restricted to the epoch from 220-420 ms following stimulus onset.
![]()
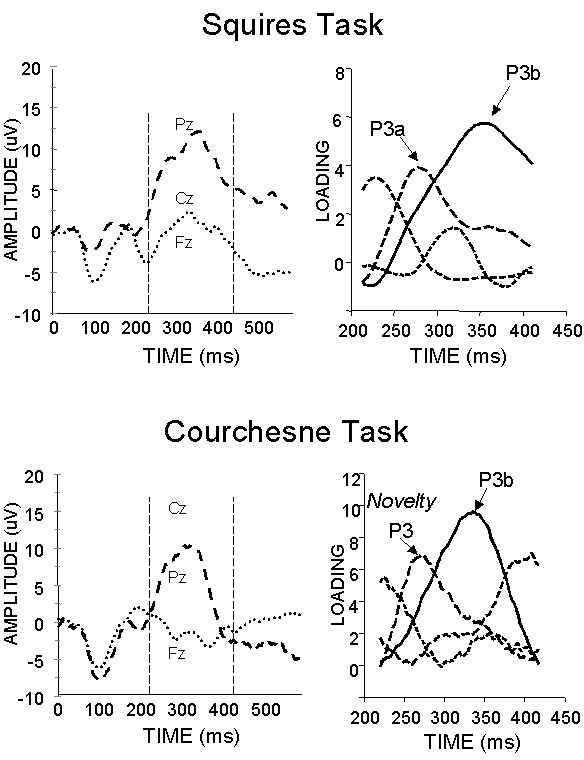
The ERP waveforms
from the two data sets are presented in Figure
1 (left). The ERPs recorded in the Squires et al. paradigm are
consistent with the description provided in the original article of ERPs
elicited by rare stimuli. The P3a
can be seen as a small deflection on the leading edge of the much larger,
parieto-central P3b. ERPs recorded
in response to the Courchesne et al. stimuli are more centrally focused and the
late positive components are less distinct, one from the other.
Thus, although both sets of ERPs are associated with prominent late
positive components, their morphologies differ, at least superficially, and the
substantial component overlap obviates a direct comparison of the
early positive component based on direct measurement of the ERP waveforms
themselves.
Roemer et al. (1990) suggest two criteria for concluding that two sets of ERPs have identical factor structures; one criterion is based on the basis waves, the second is based on the factor scores. The first criterion is to determine the relationship between the basis waves of the two data sets by computing either canonical or multiple correlations. Statistically, this approach evaluates the extent to which the PCA of one data set spans the solution based on the second data set. To this end, we computed an R2 between each basis wave (factor) of the first data set with all basis waves of the second set and then repeated the procedure moving in the opposite direction. The results of this analysis are presented in Table 1. As the data indicate, the four basis waves obtained from ‘Squires’ are accounted for almost perfectly by the basis waves of “Courchesne” and vice versa. All R2 values exceed 0.95, strongly suggesting that the two data sets have equivalent factors in the 220-420 ms data epoch.
The second method of
exploring the similarity of the two factor structures, based on factor scores,
involves the computation of simple correlations between the factor scores
derived from a basis wave from the first data set and factor scores of one or
more basis waves from the second data set.
The results of this analysis are presented in Table 2.
Particularly important to the present question is the relationship
between the P3a factor in ‘Squires’ and the Novelty-P3 factor in ‘Courchesne’.
The high correlation between the two (r=0.80) suggests that the two basis
waves, though obtained with different subjects in a different experimental
context, produce nearly equivalent factor scores.
To augment the criteria suggested by Roemer et al., we also conducted ANOVAs
on the data from each set using both sets of derived factor scores.
That is, we analyzed the data from each experiment twice.
The first analysis of each data set employed factor scores derived from
basis waves indigenous to the data set. Factor
scores for the second analysis were derived from the complimentary set of basis
waves. The logic of this procedure
is that an identity of P3a and the Novelty-P3 factors should yield identical
ANOVAs regardless of which basis waveforms underlie the factor scores.
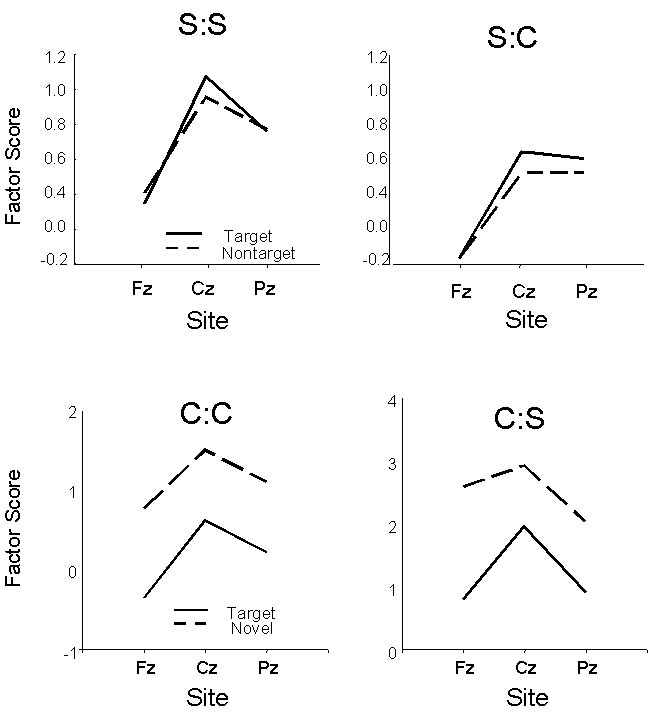
The results are presented in Figure 2 (Means) and Table
3 (ANOVA). On the top of the figure are the Stimulus (rare targets vs.
rare nontargets) X Site P3a means obtained in the “Squires” procedure.
The left-hand panel reflects the use of the ‘Squires’ basis waves; the data
on the right were generated using the ‘Courchesne’ basis waves.
In both cases, the early positivity had a central focus (though it was
more linear when computed as S:C than from S:S) and did not differ when elicited
by either target or nontarget rare stimuli (Table 3). Similarly, the bottom panel of Figure 2 depicts the central
focus of the early positive component observed during Courchesne’s novelty
task and the significant impact of novel stimuli on this component.
Again, the Stimulus (targets vs. novels) X Site effects were virtually
identical when analyzed using either the “Squires” or “Courchesne” basis
waves to generate the factor scores (Table 3).
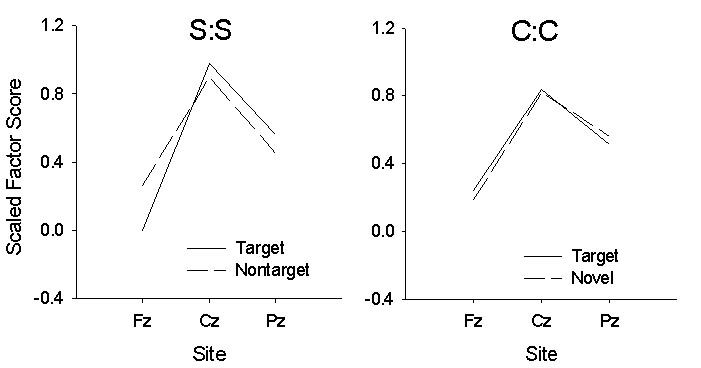
Finally, we compared the (midline) scalp distribution
of the P3a and the Novelty-P3 by scaling the data from each set for each
condition according to the min/max method described by McCarthy and Wood (1985).
The data are presented in Figure 3.
The distribution across the
The present data
analysis was undertaken to address the question of independence of two positive
ERP components that precede and overlap the ubiquitous P3b component during two
and three stimulus oddball tasks. Our
results suggest that these components are very similar, potentially the same.
To recapitulate the evidence, despite the apparent morphological
difference in the ERP waveforms (Figure 1, left), the factors identified
as the P3a and the Novelty-P3 appear identical to the eye (Figure 1, right).
More important, multiple regression shows that basis waves from the two
data sets are highly correlated and the factor scores derived from the two sets
of basis waves are highly correlated as well.
The multiple regression analysis suggests that the principal components
from the P3a data set span the same factor space as those derived from the
Novelty-P3 data set (Roemer et al., 1990).
Then, the results of ANOVAs using factor scores as dependent measures
were equivalent in all essential aspects regardless of which data set produced
the basis wave that generated the factor scores corresponding to the P3a or the
Novelty-P3. Lastly, when the factor
scores were scaled to eliminate main effects and evaluate the midline
distribution more directly (McCarthy & Woods, 1985), distributional
differences did not approach statistical significance.
As part of the
initial description of the Novelty-P3, Courchesne et al. (1975) argued that
there was little connection between it and the P3a described by Squires et al.
(1975). This assertion,
unchallenged for the most part, was based on four observations. First, the Novelty-P3 occurred under conditions of active
attention while P3a occurred during passive attention.
Second, the Novelty-P3 habituated while habituation of P3a was not noted
by Squires et al. Third, the
Novelty-P3 was elicited only by complex, unrecognizable stimuli while P3a was
elicited by simple stimuli. Fourth,
P3a occurred earlier and was smaller than the Novelty-P3.
Although space does not permit a detailed discussion of these issues, it
should be noted that latency and amplitude differences are insufficient criteria
for independence, that Katayama and Polich (1998) have convincingly demonstrated
that the Novelty-P3 can be elicited by simple acoustic stimuli, that P3a
is observed under both passive and active attention conditions (Snyder
& Hillyard, 1976; Squires et al., 1975) and that while habituation of the
Novelty-P3 has been amply demonstrated (e.g., Knight, 1996),
habituation of the P3a has never been systematically studied.
We appreciate the difficulty of establishing an
identity – it is, of course, akin to ‘proving’ the null hypothesis. In
general, null hypothesis significance testing and typical publication criteria
favor distinctions rather than identities.
Furthermore, our comparison of the two components has inherent
limitations. We limited our
measurement to the three midline sites employed in the original studies and we
employed a relatively small sample of subjects.
A more elaborate recording montage might be more sensitive to subtle
between component differences that are not apparent on the midline.
Likewise, the enhanced power that accompanies an increase in sample size
may have highlighted midline differences that we were unable to detect with nine
subjects per condition. To
compensate for these limitations, we examined the two components from multiple
vantage points. Based on the
present analysis, we would argue that the P3a and the Novelty-P3 may be
indistinguishable. While we
acknowledge the limitations of our study and all the difficulties inherent in
supporting the null hypothesis, our conclusion is nonetheless consistent with
recent data from other laboratories. Knight
(1996), for example, presented novel tactile or acoustic stimuli to subjects
unannounced during a standard target-detection task.
The novel stimuli prompted a substantial anterior P300 (Novelty-P3) while
rare target stimuli were associated with a typical P3b.
Knight noted, as did Squires et al. (1975) under target-detection
conditions, that the P3b was preceded by a small, fronto-central positivity
(P3a; see also Figure 1 above). Subjects
with posterior hippocampal lesions had a normal P3b, but a markedly reduced
Novelty-P3. Especially relevant to the identity question, Knight observed
that hippocampal damage also eliminated the P3a that was associated with the
rare targets. Likewise,
studies of patients with Parkinson’s disease have found amplitude reductions
over frontal recording sites in the Novelty-P3 (Tsuchiya, Yamaguchi &
Kobayashi, 2000) and a virtual absence of the early positive peak (P3a)
associated with rare targets in the traditional oddball task (Lagopoulos et al.,
1998). And, using a high-density
electrode array, Spencer, Dien & Donchin (in press) identified a Novelty-P3
factor based on a combination of temporal and spatial information that was
evident in response to both ‘novel’ stimuli and to rare targets.
In sum, we believe that the arguments originally marshaled in support of the distinction between the Novelty-P3 and the P3a have not been empirically supported, and we believe that new data such as those obtained from our own factor analysis, those obtained from high-density electrode arrays, and those obtained from patients with neurological lesions are more consistent with an identity hypothesis and now shift the burden of proof back to those who wish to continue a case for distinction.
Clark, V.P., Fannon, S., Lai, S., Benson, R. & Baure, L. (2000). Responses to rare visual target and distractor stimuli using event-related fMRI. Journal of Neurophysiology, 83, 3133-3139.
Comerchero,
M. & Polich, J. (2000). P3a,
perceptual distinctiveness, and stimulus modality.
Cognitive Brain Research, 7, 41-48.
Comerchero,
M. & Katayama, J. & Polich, J.
(2000). P3a and P3b from
auditory and visual stimuli (abstract).
Psychophysiology, 34, S27.
Courchesne,
E., Hillyard, S.A., & Galambos, R.
(1975). Stimulus
novelty, task relevance and the visual evoked potential in man. Electroencephalography and Clinical Neurophysiology, 39,
131-143.
Courchesne,
E., Kilman, B.A, Galambos, R. & Lincoln, A.J. (1984).
Autism: Processing of novel auditory information assessed by
event-related brain potentials. Electroencephalography
and Clinical Neurophysiology, 59, 238-248.
Cycowicz,
Y.M. & Friedman, D. (1999).
The effect of intention to learn novel, environmental sounds on the
novelty P3 and old/new recognition memory.
Biological Psychology, 50, 35-60
Gratton,
G., Coles, M. G. H., & Donchin, E. (1983). A new method for off-line
removal of ocular artifact. Electroencephalography and Clinical
Neurophysiology, 55, 468-484.
Harmony,
T., Bernal, J., Fernandez, T., Silva-Pereyra, J., Fernandez-Bouzas, A.,
Marosi, E., Rodriquez, M. & Reyes, A. (2000).
Primary task demands modulate P3a amplitude. Cognitive Brain Research, 9, 53-60.
Kaipio,
M.L., Cheour, M., Ceponiene, R., Ohman, J., Alku, P. & Naatanen, R.
(2000). Increased
distractibility in closed head injury as revealed by event-related
potentials. Neuroreport, 11, 1463-1468.
Katayama,
J. & Polich, J. (1998).
Stimulus context determines P3a and P3b.
Psychophysiology, 35, 23-33.
Knight, R.T.
(1984). Decreased response to
novel stimuli after prefrontal lesions in man.
Electroencephalography and Clinical Neurophysiology, 59,
9-20.
Knight,
R.T. (1996). Contribution of human hippocampal region to novelty
detection. Nature, 383,
256-259.
Knight,
R.T. & Scabini, D. (1998).
Anatomic bases of event-related potentials and their relationship to
novelty detection in humans. Journal
of Clinical Neurophysiology, 15, 3-13.
Lagopoulos,
J., Gordon, E., Barhamali, H., Lim, C.L., Lee, W.M., Clouston, P., &
Morris, J.G. (1998). Dysfunctions
of automatic (P300a) and controlled (P300b) processing in Parkinson’s
disease. Neurological
Research, 20, 5-10.
Mathalon,
D.H., Ford, J.M. & Pfefferbaum, A. (2000).
Trait and state aspects of P300 amplitude reduction in schizophrenia:
A retrospective longitudinal study. Biological
Psychiatry, 47, 434-449.
McCarthy,
G. & Wood, C. C. (1985). Scalp
distributions of event-related potentials: An ambiguity associated with
analysis of variance models. Electroencephalography
and Clinical Neurophysiology, 62, 203-208.
Mecklinger,
A. & Ullsperger, P. (1995).
The P300 to novel and target events: A spatio-temporal dipole model
analysis. Neuroreport: An
International Journal for the Rapid Communication of Research in
Neuroscience, 7, 241-245.
Miller, G.
A., Gratton, G., & Yee, C. M. (1988). Generalized implementation of an
eye movement correction procedure. Psychophysiology, 25,
241-243.
Roemer,
R.A., Josiassen R.C., &
Shagass, C. (1990).
Comparing principal components analyses of evoked potentials recorded
from heterogeneous groups of subjects.
Psychophysiology, 27, 101-110.
Snyder,
E. & Hillyard, S.A. (1976). Long-latency
evoked potentials to irrelevant, deviant stimuli. Biological Psychology, 16, 319-331.
Spencer,
K.M., Dien, J. & Donchin, E. (1999).
A componential analysis of the ERP elicited by novel events using a
dense electrode array. Psychophysiology,
36, 409-414.
Spencer,
K.M., Dien, J. & Donchin, E. (2001).
Spatiotemporal analysis of the late ERP responses to deviant stimuli.
Psychophysiology, 38, 343-358.
Squires,
K.C., Donchin, E., Herning, R.I. & McCarthy, G. (1977). On the influence of task relevance and stimulus probability
on event-related potential components.
Electroencephalography and Clinical Neurophysiology, 42,
1-14.
Squires,
N.K., Squires, K.C. & Hillyard, S.A. (1975).
Two varieties of long-latency positive waves evoked by unpredicable
auditory stimuli in man. Electroencephalography
and Clinical Neurophysiology, 39, 387-401.
Tsuchiya, H., Yamaguchi, S., & Kobayashi, S. (2000). Impaired novelty detection and frontal lobe dysfunction in Parkinson’s disease. Neuropsychologia, 38, 645-654.
![]()
![]()
1. Discriminating among the stimuli was an easy task. Thirteen of the 18 subjects were completely accurate, three subjects were within plus or minus 1 of the correct count for the experiment. Two subjects were confused by the introduction of the unexpected novels during the Courchesne task, but quickly righted themselves and made no additional errors. The overall error-rate did not differ in the two procedures.
Figure
1. ERP waveforms (left) and PCA
basis waves (right) obtained from infrequent targets during the Squires (top)
task and infrequent nontargets/novels during the Courchesne (bottom) task.
PCA was conducted during the 220-420 ms epoch following stimulus onset
and four factors were extracted from each data set.
Figure
2. Factor scores for Squires- (top)
and Courchesne-task (bottom) data. Two
sets of factor scores were computed: The
first associated with the basis wave corresponding to P3a in the Squires (:S)
replication and the second associated with the Novelty-P3 from the Courchesne
(:C) replication.
Figure 3. Scaled factor scores for Squires- (left) and Courchesne-task (right) data. Scores were scaled using the McCarthy & Woods (1985) min/max procedure separately for each stimulus condition removing all main effects other than electrode location.
![]()
Table 1.
Relationships (Multiple Correlations) between PCA basis waves (factors)
obtained from ERPs elicited in the Squires and Courchesne tasks.
|
Factor |
C:Sa |
S:Cb |
|
1 |
0.992 |
0.962 |
|
2 |
0.984 |
0.992 |
|
3 |
0.996 |
0.986 |
|
4 |
0.951 |
0.983 |
aC:S
– entire set of basis waves derived from the Courchesne-task data is
correlated with each basis wave from the Squires-task data
bS:C – entire set of basis waves derived from the Squires-task data is correlated with each basis wave from the Courchesne-task data
![]()
Table 2. Product-moment
correlation coefficients between factor scores based on PCA of the Squires-task
and Courchesne-task data sets. Factor
2 refers to the Novelty-P3 in the Courchesne-task and the P3a in the Squires
task.
|
|
C:
Factor 1 |
C:
Factor 2 |
C:
Factor 3 |
C:
Factor 4 |
|
S:
Factor 1 |
.56 |
-.15 |
.83 |
.07 |
|
S:
Factor 2 |
.21 |
.80 |
-.12 |
-.27 |
|
S:
Factor 3 |
-.09 |
.28 |
.13 |
.90 |
|
S:
Factor 4 |
.60 |
.01 |
-.41 |
.05 |
![]()
|
Procedure |
Analysis |
ANOVA
Factor |
||
|
Squires |
S:Sa |
Stimulus df=1, 8 |
Site df=1, 8 |
Stim
X Site df=1, 8 |
|
F
< 1 |
Flin=2.4, p > .10 |
Flin
< 1 |
||
|
Fquad=9.5, p < .05 |
Fquad=2.2,
p > .10 |
|||
|
S:Cb |
F
< 1 |
Flin=15.3, p < .01 |
Flin
< 1 |
|
|
Fquad=7.3,
p < .05 |
Fquad=1.4,
p > .10 |
|||
|
Courchesne |
C:Cc |
F
= 6.6, p < .05 |
Flin=4.4,
p > .05 |
Flin
< 1 |
|
Fquad=39.9, p <.01 |
Fquad
< 1 |
|||
|
C:Sd |
F
= 6.7, p< .05 |
Flin
< 1 |
Flin=2.0,
p > .10 |
|
|
Fquad=32.
9, p < .01 |
Fquad=4.9,
p > .05 |
|||
aS:S – P3a factor derived from Squires-task basis
waves
bS:C – P3a factor derived from Courchesne-task basis
waves
cC:C – Novelty-P3 factor derived from Courchesne-task
basis waves
dC:S – Novelty-P3 factor derived from Squires-task basis waves
![]()